Fig. 3.

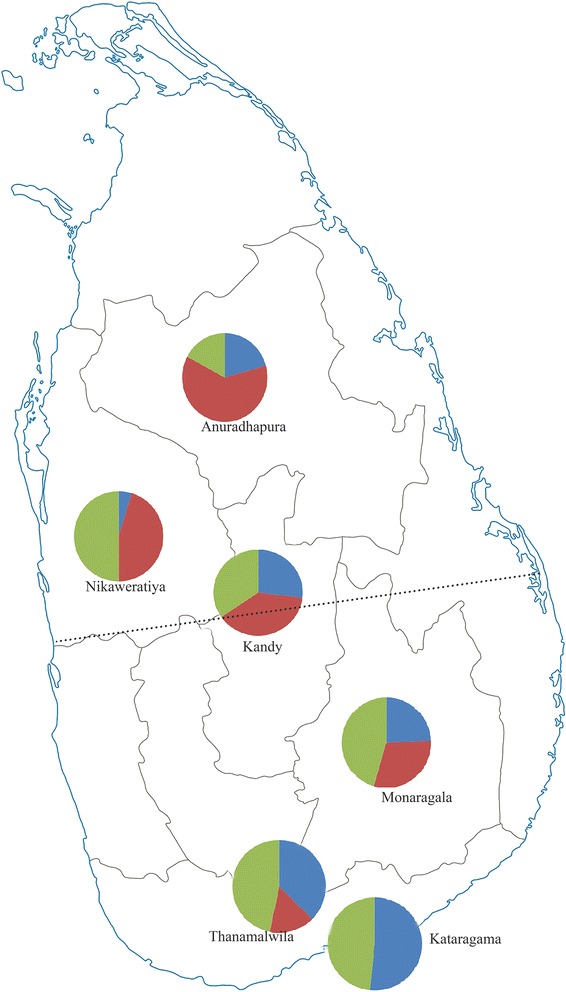
Graphical representation of cluster proportions at the six collection sites. The dotted line shows the barrier to gene flow (cluster I-red, cluster II-green, cluster III-blue)

Graphical representation of cluster proportions at the six collection sites. The dotted line shows the barrier to gene flow (cluster I-red, cluster II-green, cluster III-blue)