
Fig. 1.
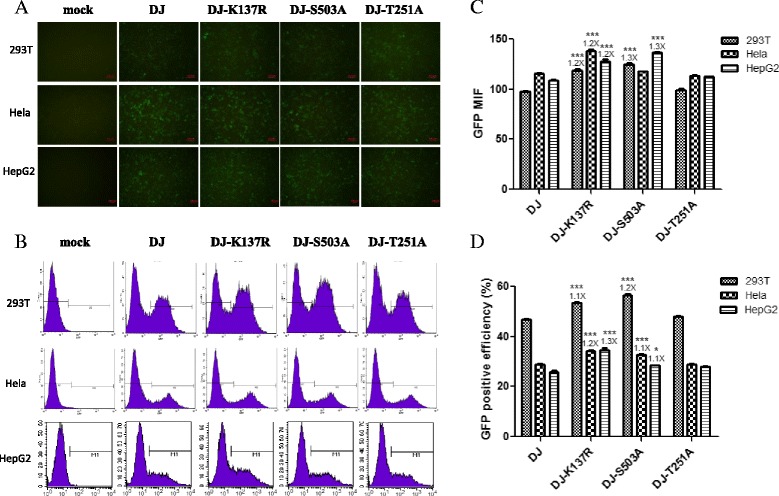
Analysis of AAV-DJ and its mutant vectors transduction efficiency in vitro. 293 T, Hela and HepG2 cells were either mock infected or infected with AAV vectors at an MOI of 1000, and 48 h later GFP expression was observed by fluorescent microscope (a) and measured by flow cytometry (b). Quantitive analysis of the mean fluorescent signal intensities (MFI) (c) and GFP positive efficiency (d) of these cell lines were shown. Levels of significance were determined using one-way analysis of variance. The data are shown as mean values ± SEM