
Fig. 1.
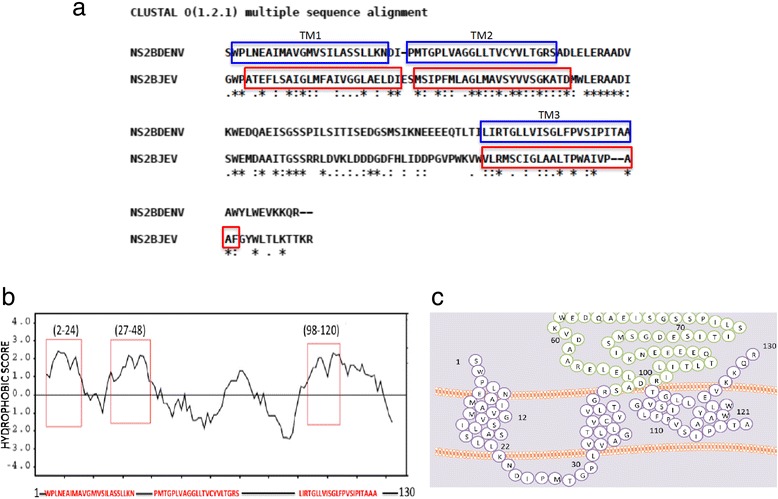
In silico analysis of the NS2B sequence. a Alignment of the NS2B sequences of DENV and JEV, using Clustal W software. The 3 transmembrane regions are indicated using blue and red boxes. Within these zones, identical (*), similar (.), and low-similarity (:) amino acids were observed. b Hydropathy plot of the NS2B protein generated using the Kyte–Doolittle method with SOSUI software. The red boxes delimit the transmembrane regions of the NS2B protein. c Proposed model of the NS2B topology, which was generated using SOCS MEMSAT software. In this model, the transmembrane segments are shown in purple, and green coloration represents the NS2B cofactor domain