
Fig. 4.
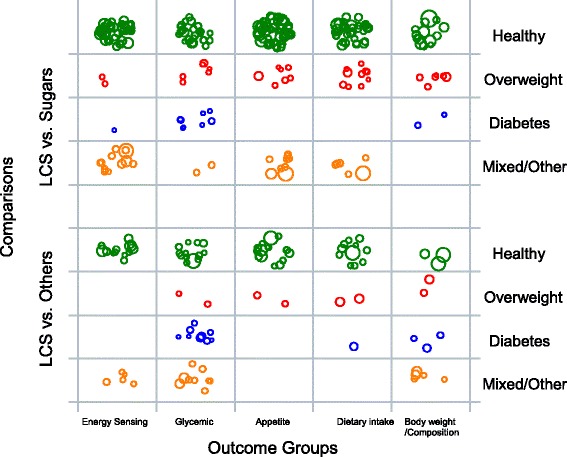
Example bubble plot of LCS studies by intervention type and health status. Legends: LCS vs. Sugars: An intervention comparison between LCS and sugars or sugars and LCS; LCS vs. Others: An intervention comparison between LCS and non-sugar arm or a single arm study. Other or mixed: A mixture of healthy and overweight, healthy and diabetic, or overweight and diabetic population, and other population: patient or people with disease at baseline. Each bubble represents one single study. Bubble size corresponds to study sample size