
Fig. 2.
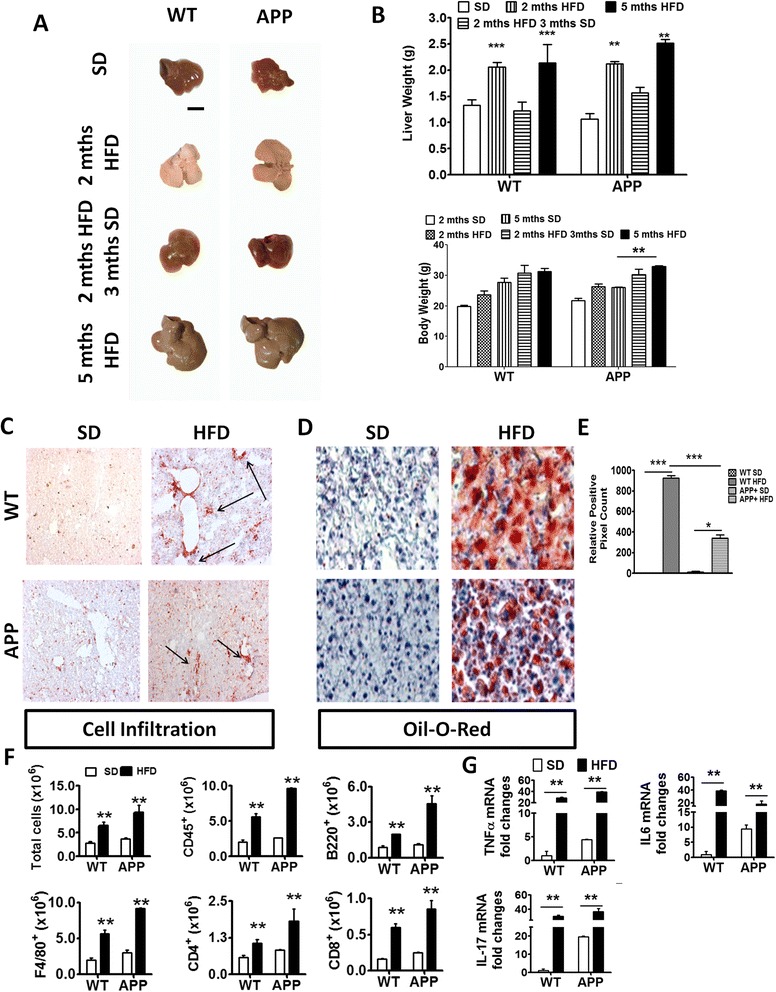
HFD induced acute liver pathology and inflammation in WT and APP-Tg and mice. a Representative images of livers from WT or APP-Tg mice fed with HFD or SD, with corresponding liver and body weights of their respective age-matched SD-fed controls. Scale bar indicates 5 mm (b). ** and *** indicate p < 0.01 and p < 0.001, respectively (two-way ANOVA with Bonferroni post-test). c Representative CD45+ staining of liver sections from WT or APP-Tg mice fed with SD or HFD for 2 months. d Representative oil O-red staining on frozen tissue sections of livers from WT or APP-Tg mice fed with SD or HFD for 2 months. e Relative positive pixel count of oil O-red staining quantified using Zen software (Carl Zeiss). * and *** indicate p < 0.05 and p < 0.001, respectively (two-way ANOVA with Bonferroni post-test). f Quantitative analysis of total leukocyte numbers (CD45+) isolated from the livers of 2-month SD or HFD-fed WT and APP-Tg mice by flow cytometry. ** indicates p < 0.01 (two-way ANOVA with Bonferroni post-test, n = 3/group). g TNF-α, IL-6, and IL-17 mRNA expression in livers of WT and APP-Tg mice fed with SD or HFD for 2 months. ** indicates p < 0.01 (two-way ANOVA with Bonferroni post-test, n = 3/group, representative experiment of four independent experiments)