Fig. 4.

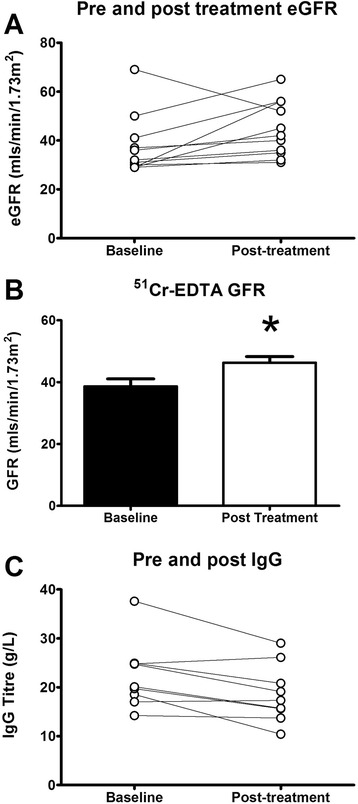
Shows data from treated patients. Panel a shows the MDRD eGFR pre and post treatment, panel b shows the measured 51Cr-EDTA GFR pre and post treatment in 6 of the patients, and panel c shows serum IgG levels pre and post treatment

Shows data from treated patients. Panel a shows the MDRD eGFR pre and post treatment, panel b shows the measured 51Cr-EDTA GFR pre and post treatment in 6 of the patients, and panel c shows serum IgG levels pre and post treatment