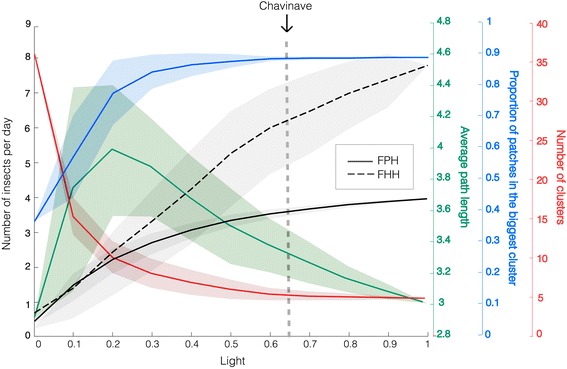
Fig. 3.

Epidemiological indexes II. Model output also included the average numbers of insects per day moving from palms to houses (FPH) and between houses (FHH) (y axis). Average fluxes and standard deviations were computed at steady state for every set of simulation for a particular value of light (x axis). Fluxes from houses to palms (FHP) were not observed in the simulations. Network metrics, as described in Fig. 2, are shown with solid colored lines with their corresponding standard deviations. For Chavinave the model predicts an FPH of 3.5 insects per day and an FHH of about 6.2 insects per day
