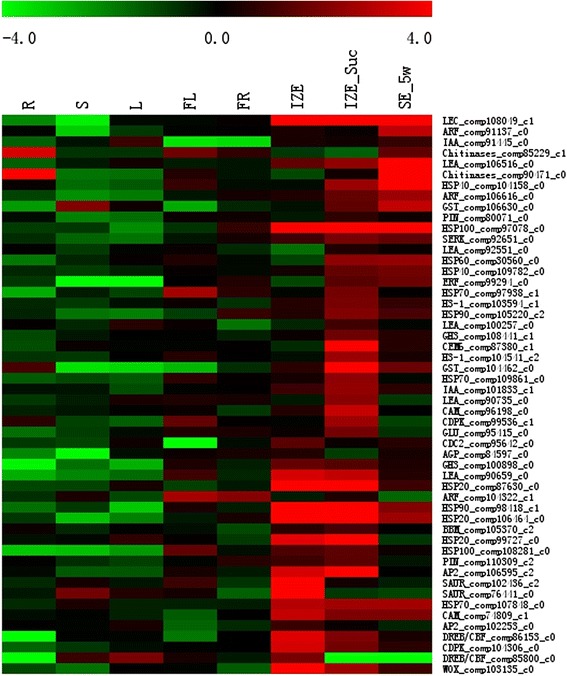
Fig. 9.

Expression patterns of 52 somatic embryogenesis-related DEGs in different tissues. The bar represents the scale of relative expression levels of DEGs, and the colors indicate relative signal intensities of DEGs. R roots, S stems, L young leaves, FL young flowers, FR young fruits, IZE immature zygotic embryos, IZE_Suc IZE pretreated with 1.0 M sucrose solution, SE_5w somatic embryos obtained from induction medium after culture for 5 weeks
