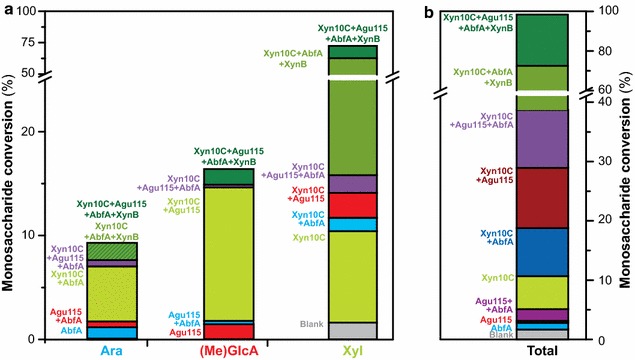
Fig. 4.

Monosaccharide conversion by the synergistic combination of glycoside hydrolases. a Individual monosaccharide conversion (Ara, MeGlcA, Xyl). b Total monosaccharide conversion. The histograms show the increasing conversion of each and total monosaccharides released by each enzyme or enzyme combination, expressed as the percentage of the theoretical maximal conversion based on the GAX content in the substrate (Additional file 1: Table S1). The colour key indicates which enzymes are present in a reaction, showing that there is a cumulative increase in the amount of each sugar released with the inclusion of each additional enzyme into the mixture
