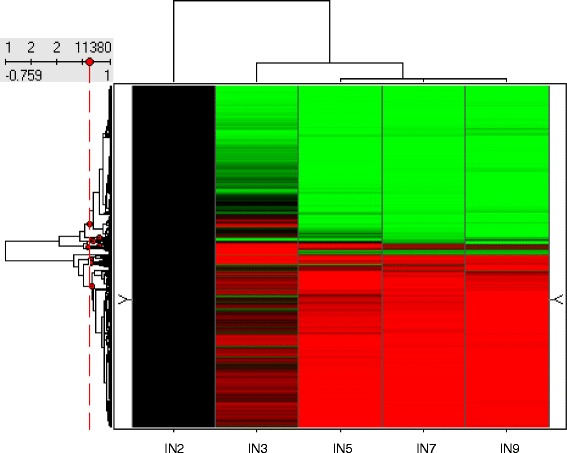
Fig. 2.

Gene cluster analysis based on expression patterns. Among the 61,281 probe sets in the Affymetrix Medicago genome array, 11,380 probe sets showed increased or decreased expression (≥2-fold) in older internodes compared to the second internode. Genes with changed expression were clustered into 10 different categories based on their expression pattern. Red dots indicate the branch point of each cluster. Black indicates no change; green indicates down-regulation and red indicates up-regulation of expression. IN refers to internode number
