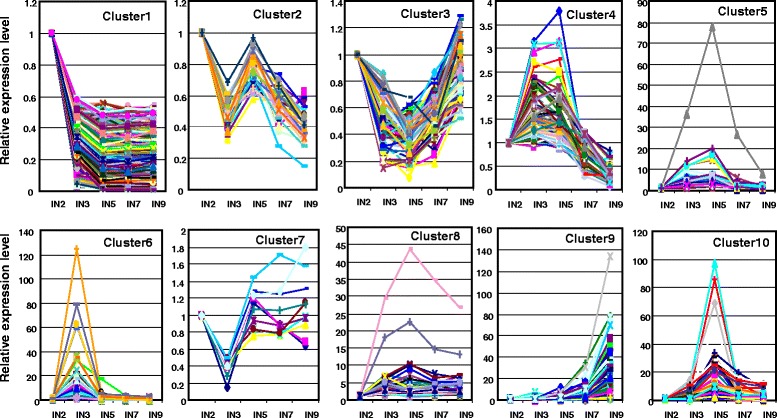
Fig. 3.

Expression patterns of the 10 gene clusters. Genes in the 10 clusters showed distinct expression patterns in the five characterized internodes. The horizontal axes represent the relative gene expression in internode 2 (IN2), internode 3 (IN3), internode 5 (IN5), internode 7 (IN7) and internode 9 (IN9), respectively
