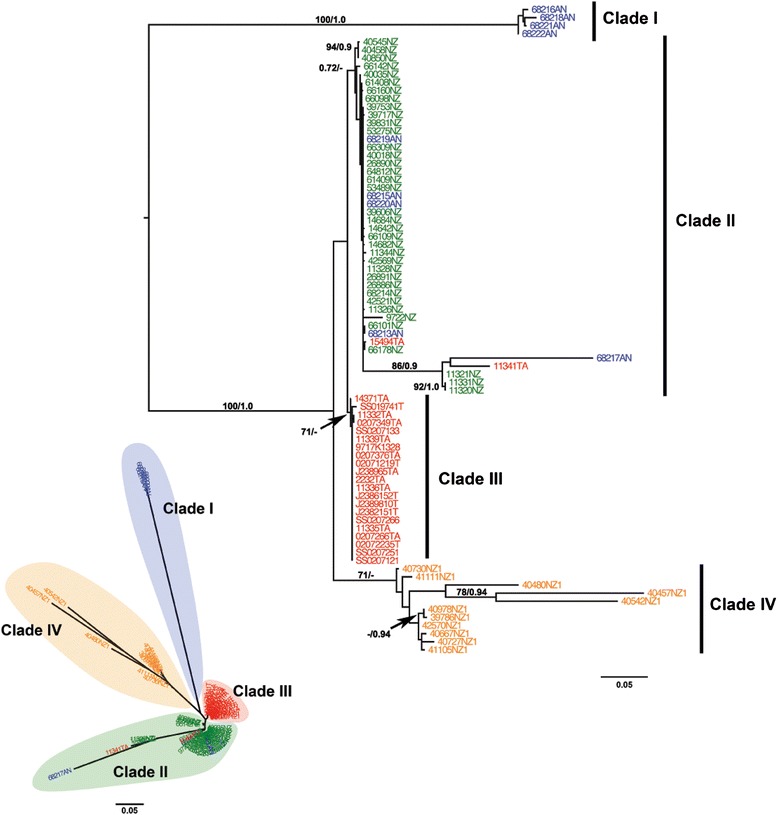
Fig. 3.

Maximum Likelihood tree based on concatenated ITS2 and 28S gene sequences. The lower left figure shows the un-rooted tree while the figure on the right shows the mid-point rooted topology for the primnoid bottlebrush octocorals from the South Pacific and Southern Ocean. Support values are provided if higher than 70 % for ML and 0.9 for BI (actual BI trees are not shown). The colours of the sample names correspond to the localities: red for Tasmania, green for New Zealand, orange for Macquarie Ridge, and blue for Antarctica
