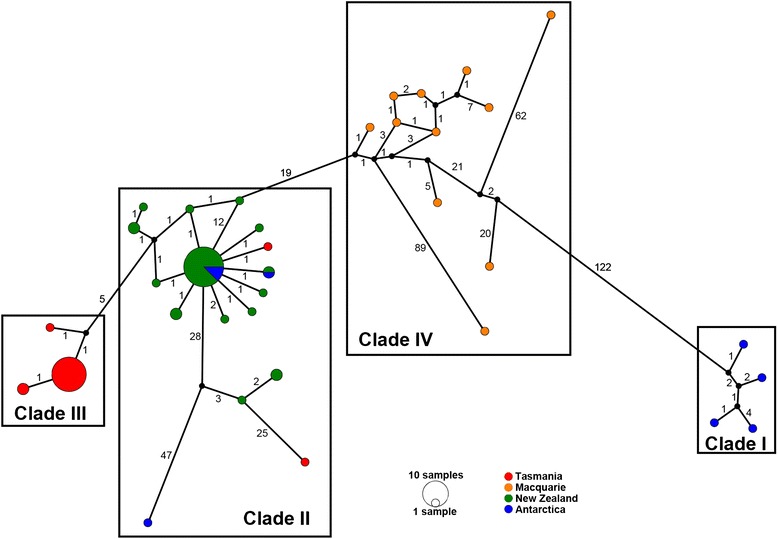
Fig. 4.

Median-joining network based on 80 concatenated ITS2 and 28S sequences from the bottlebrush deep-sea octocorals. A coloured circle represents each unique haplotype and its area is proportional to its relative frequency in the data set. Colours indicate the proportion of individuals sampled in each region. Small black circles represent intermediate haplotypes, and numbers along branches represent the number of substitutions among haplotypes. The structure of the clades corresponds to the one in Fig. 2
