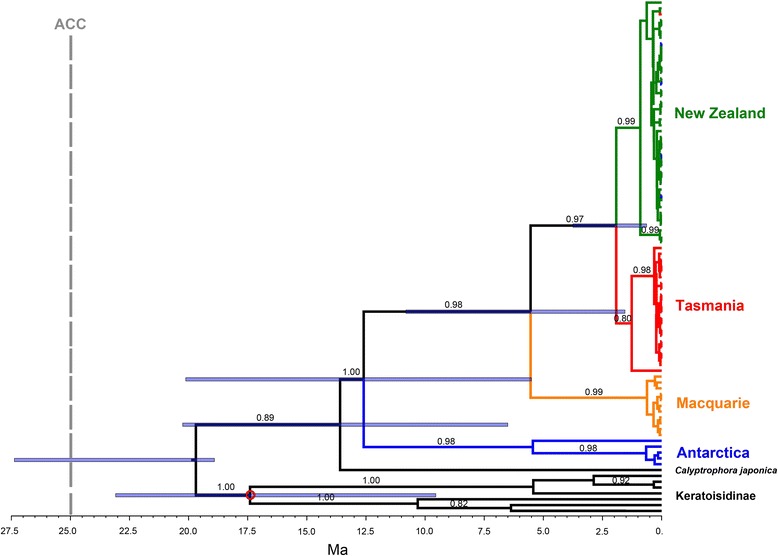
Fig. 6.

Timetree obtained using Bayesian MCMC phylogenetic analyses in BEAST 1.8 [82] based on ITS2 gene sequences. Values above branches are posterior probabilities above 0.8 for the main clades. The blue bars represent the 95 % highest posterior density (HPD) interval for the divergence time estimates, shown only for clades of interest. The red circle represents the calibrated node. See text for fossil calibration details. The vertical line represents the onset of the Antarctic Circumpolar Current (ACC), estimated at 25 Ma [8]
