
Fig. 3.
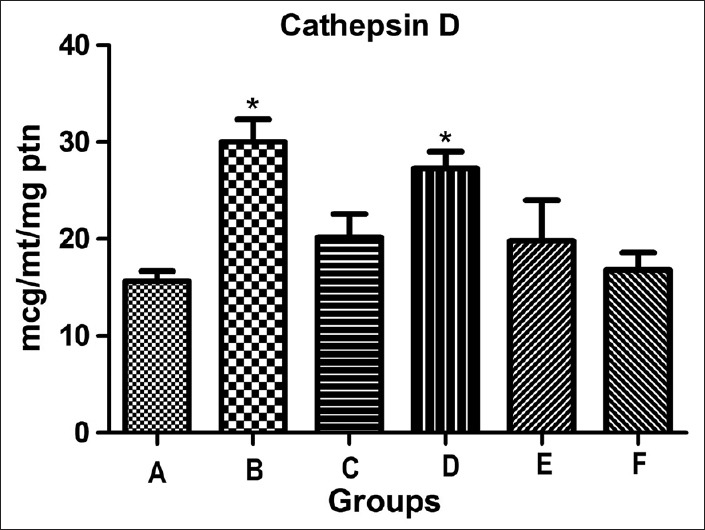
Effect of heptoplus on liver lysosomal cathepsin D.
All value expressed in mean±SEM, n=6, *P≤0.05 statistically significant compared to group I. A: control group; B: INH+RIF group; C: Liv 52 group; D: INH+RIF+HP (50 mg) group; E: INH+RIF+HP (100 mg) group and F: 100 mg HP group.