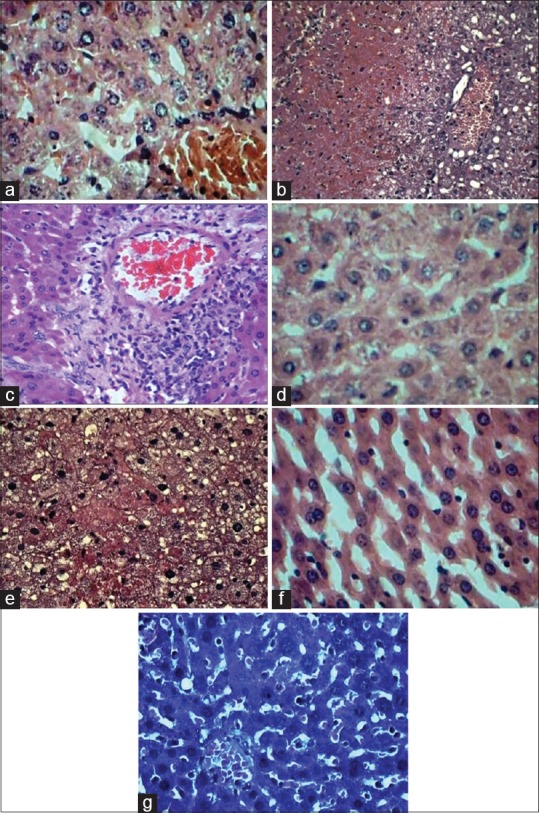
Fig. 4.

Histopathological analysis of liver.
(a) Liver sections showing normal hepatocytes with central veins, H&E ×400, Group I: rats receiving CMC (vehicle), served as control; (b) liver section showing severe degree of hemorrhages, centrilobular necrosis with fatty vacuolations, H&E ×100, Group II: rats treated with 50 mg/kg of each RIF and INH; (c) liver sections (group II) showing perivascular infiltration with mononuclear cells, H&E ×100; (d) liver section showing normal hepatocytes with central vein, H&E x400, Group III: rats suplimented with 100 mg/kg of Liv 52; (e) liver sections showing moderate degree of vascular changes, fatty vacuolations and decreased hepatic necrosis, H&E ×400, Group IV: rats co-administered with 50 mg/kg of heptoplus (HP low dose); (f) liver sections showing normal hepatocytes, H&E ×400, Group V: rats supplemented with 100 mg/kg of heptoplus (HP high dose); (g) liver sections showing normal hepatocytes, H&E ×400, Group VI: rats treated with heptoplus alone.
