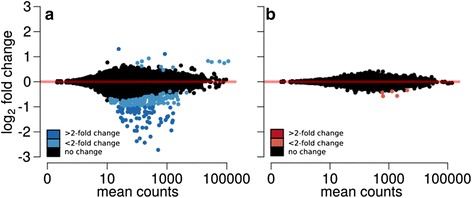
Fig. 2.

Ratio average plots of differentially expressed genes between treatments. Differentially expressed genes between treatments separately for (a) males and (b) females. The different colours refer to the differences in fold changes (FC). Positive and negative fold changes indicate genes with treatment- and control -biased expression respectively
