Fig. 2.

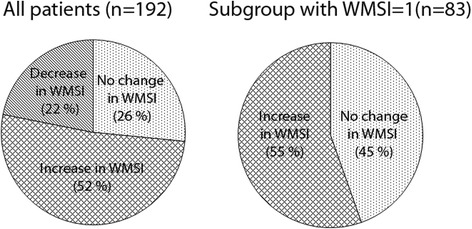
The change in wall motion score index (WMSI) when comparing contrast analysis with greyscale analysis for the whole patient group (left) and the subgroup without wall motion abnormalities (right)

The change in wall motion score index (WMSI) when comparing contrast analysis with greyscale analysis for the whole patient group (left) and the subgroup without wall motion abnormalities (right)