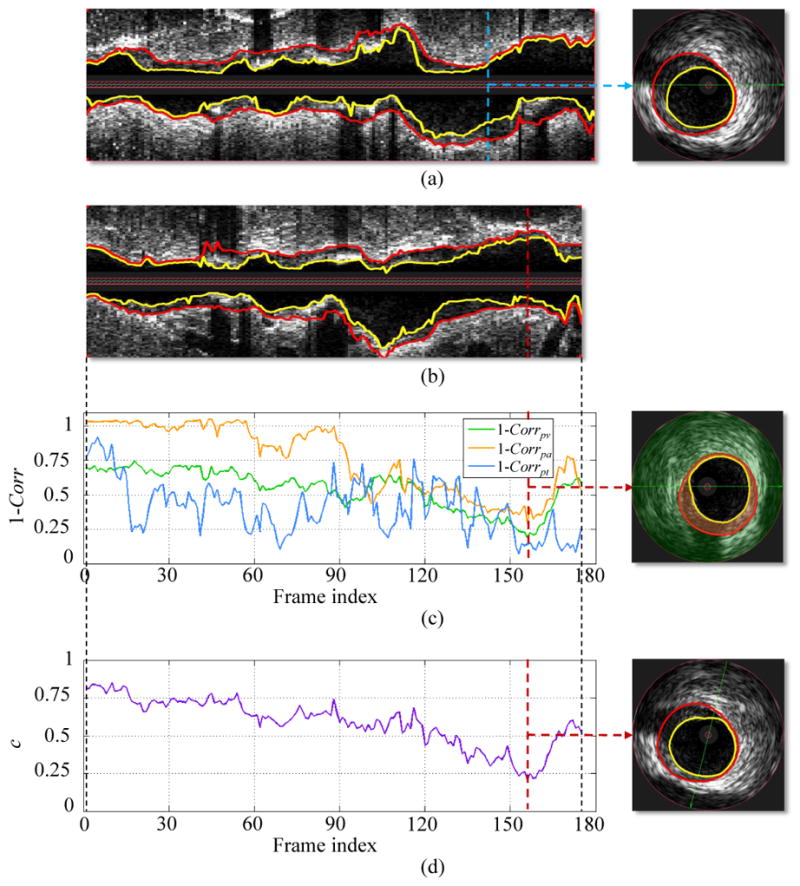
Fig. 4.

Cost function designed for IVUS pullback registration. (a) Longitudinal and cross-sectional views of a baseline IVUS pullback with expert-defined segmentation (lumen - yellow, EEL - red). (b) Longitudinal view of corresponding follow-up IVUS pullback. (c) Cost function of 1 − Corrpv, 1 − Corrpa, and 1 − Corrpt. Costs are calculated by comparing the IVUS image frame given in panel (a) with all follow-up IVUS image frames in panel (b). Each value on a curve corresponds to the minimal value with respect to all possible rotations of a follow-up frame. In the cross-sectional view, the perivascular tissue and plaque are overlaid with green and orange colors, respectively. (d) Cost function c considering all follow-up images.
