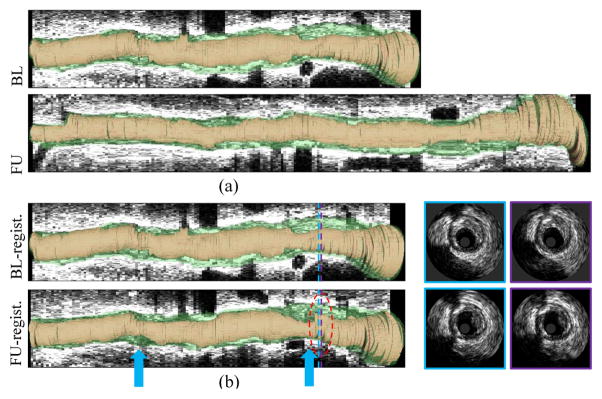
Fig. 7.
Three-dimensional visualization of IVUS pullback registration. (a) Original pullback pair. (b) Automatically registered pullback pair. Lumen shown in orange, EEL surface in green. Notice that two segments become narrower (blue arrows) and that plaque rupture is visible at follow-up (red circle, in which two registered IVUS image pairs are shown on the right side).

