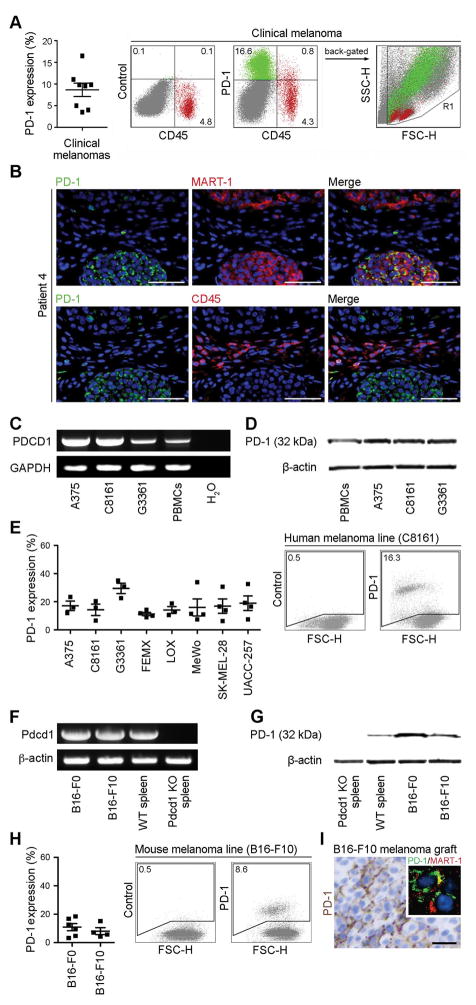
Figure 1. PD-1 expression by melanoma cells.
(A) Percentages (mean±s.e.m.) (left) and representative flow cytometry plots (right) of PD-1 surface protein expression by clinical tumor biopsy-derived melanoma cells (green) from n=8 distinct melanoma patients. These cells are negative for the CD45 lymphocyte common antigen (red) and the CD31 endothelial marker (see also Fig. S1A). (B) Representative immunofluorescence double staining of a clinical melanoma biopsy for co-expression of PD-1 (green) and MART-1 (red) or of PD-1 (green) and CD45 (red) on a serial tissue section. Nuclei were counterstained with DAPI (blue). Size bars, 100μm. Representative of n=22/36 melanoma patients demonstrating melanoma-PD-1 positivity. A patient was considered melanoma-PD-1 positive if any tumor biopsy (total of n=50) showed expression of PD-1 by MART-1+ and/or CD45− cells. See also Table S1. (C) RT-PCR expression analysis of full-length PD-1 (PDCD1) mRNA and (D) immunoblot of PD-1 protein expression by human melanoma lines and PBMCs. (E) Percentages (mean±s.e.m., left) and representative flow cytometry plots (right) of PD-1 surface protein expression by human melanoma lines (n=3–4 independent experiments, respectively). (F) RT-PCR expression analysis of full-length PD-1 (Pdcd1) mRNA and (G) immunoblot of PD-1 protein expression by murine B16-F0 and B16-F10 melanoma cells, wildtype (WT) and Pdcd1 knockout (KO) C57BL/6-derived splenocytes. (H) Percentages (mean±s.e.m., left) and representative flow cytometry plots (right) of PD-1 surface protein expression by B16 cells (n=4–6 independent experiments, respectively). (I) Representative PD-1 immunohistochemistry and immunofluorescence double staining for co-expression of PD-1 (green) with MART-1 (red) (inset photomicrograph) of a B16-F10 melanoma graft grown in NSG mice (size bar, 50μm). See also Figures S1 and S2, and Table S1.

