
Fig. 2.
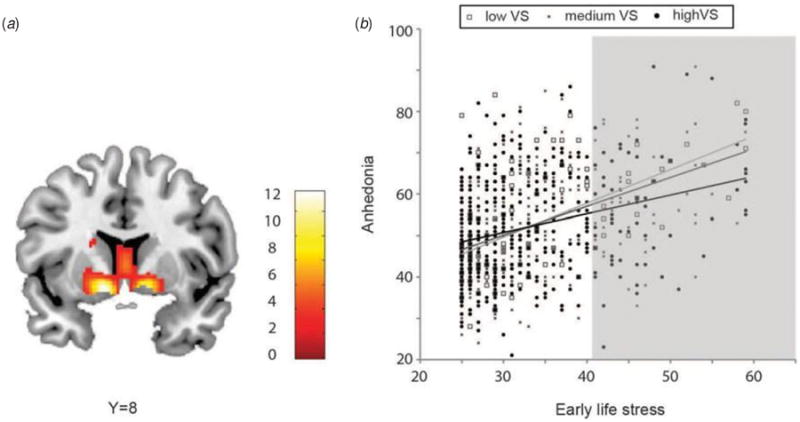
(a) Statistical parametric map illustrating bilateral ventral striatum (VS) activation clusters for the contrast ‘positive reward > negative loss’ overlaid onto a canonical structural brain image Montreal Neurological Institute coordinates and statistics (p < 0.05, family-wise error whole-brain corrected and ≥10 contiguous voxels): left hemisphere: x = −12, y = 8, z= −10, t = 13.59, p < 0.001; right hemisphere: x = 12, y = 10, z = −8, t = 12.63, p < 0.001. (b) Left VS reactivity moderates the relationship between early life adversity anhedonic symptoms (Left VS: ΔR2 = 0.0045, b = −0.7552, F1,789 = 6.35, p = 0.0119). Data plotted are raw values. Lines represent participants with low VS reactivity (light grey; −1 s.d.), medium VS reactivity (grey; average), and high VS reactivity (black; +1 s.d.). Shaded area represent Johnson–Neyman area of significance. (CTQ score >41.56).