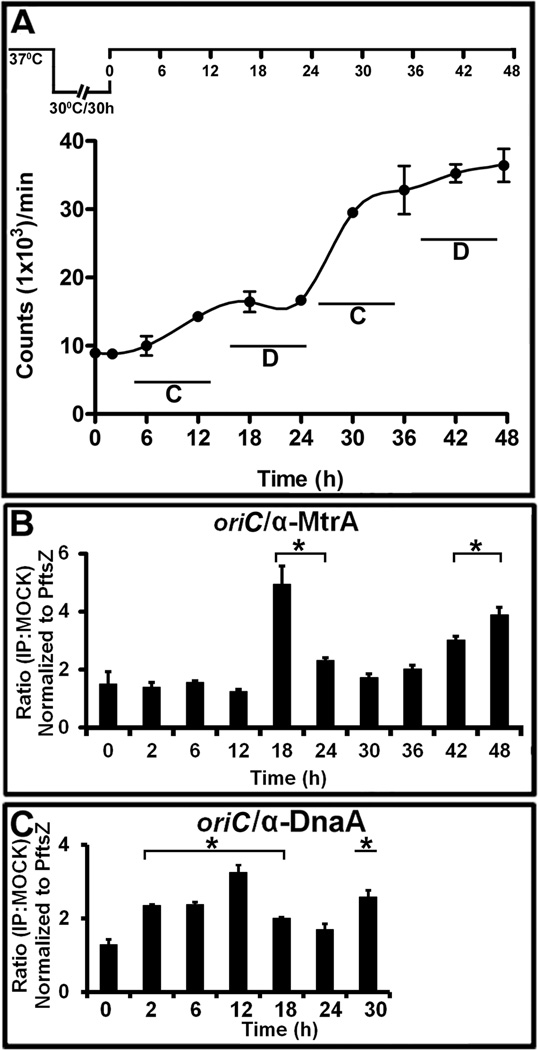
Fig. 3.
The MtrA and DnaA occupancy of oriC in synchronously replicating cultures. (A) DNA synthesis was measured as 3H-uracil incorporation, normalized to OD600=1 and presented as counts per minute (CPM) on the Y-axis. The X-axis shows the time periods when samples were processed. The C and D periods are marked for clarity. A typical dnaAcos synchronization plan is also shown at the top of this panel. (B) ChIP-PCR assay showing the MtrA occupancy of oriC during the cell cycle. The ChIP assay was performed at the indicated time points with α-MtrA followed by PCR of oriC (MtrA target) and PftsZ (non-target). The ratio of IP to the mock signal was determined for each time point, normalized against the PftsZ promoter value and shown on the Y-axis. The p-values were calculated by Student’s unpaired t-test and * denotes a p-value ≤0.05 for samples showing significant enrichment of 2 and above. (C) ChIP-PCR assay showing the DnaA occupancy of oriC during the cell cycle. All experimental conditions and details as described in ‘B’ except that DnaA antibodies were used to process samples.

