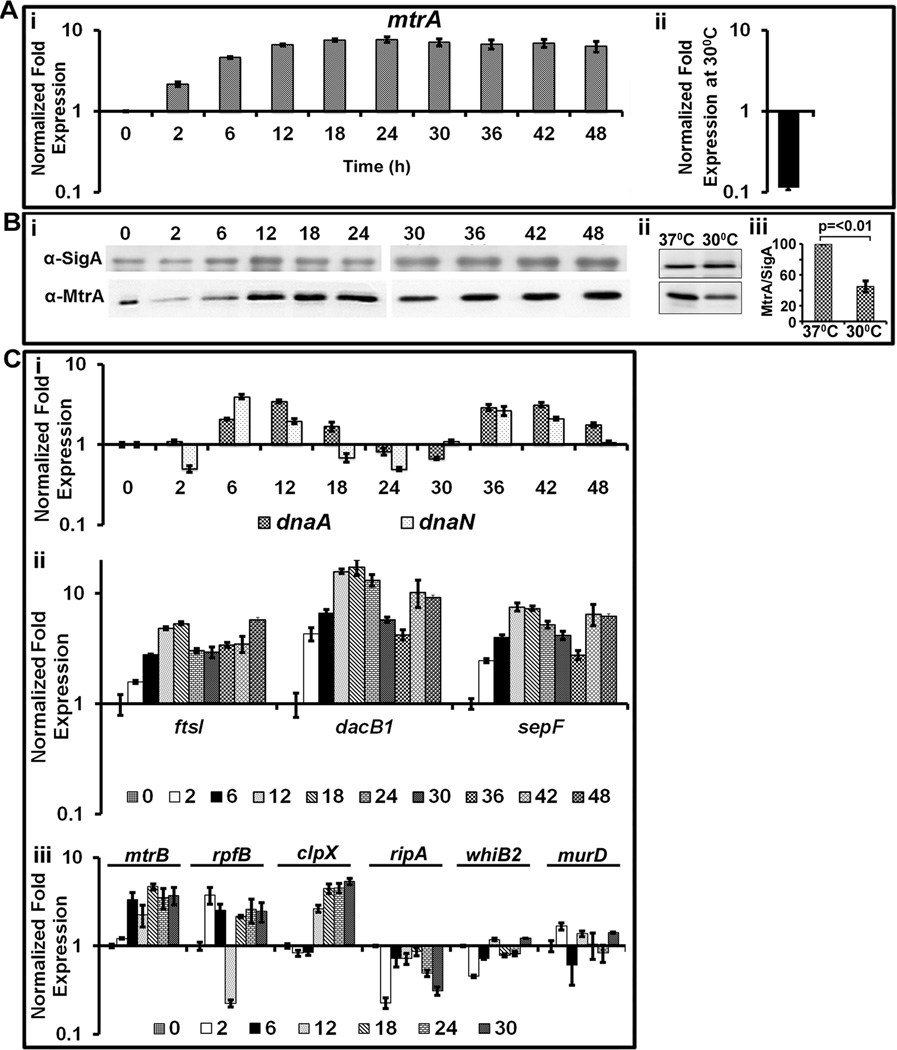
Fig. 4.
Evaluation of the mtrA transcript, protein and select target expression as a function of cell cycle. (A) qRT-PCR analysis of mtrA transcript levels: Panel i: Total RNA from synchronously replicating cultures of M. tuberculosis dnaAcos at the indicated time points were extracted and the expression levels of 16S rRNA and mtrA were determined. Data shown are normalized to 16SrRNA and fold expression relative to 30°C is shown. Panel ii shows mtrA expression levels in dnaAcos grown at 30°C for 30 h and normalized against that actively growing at 37°C. (B) Immunoblots showing MtrA and SigA: Total proteins were extracted from synchronously replicating dnaAcos samples at indicated time periods, probed with α-MtrA and α-SigA to determine expression levels of MtrA during cell cycle. Note: Two micrograms of lysates were loaded for each time point except for 0 h sample, for which 5 µg of lysate was loaded to detect MtrA as its concentration was reduced under non-growing conditions. Panel ii- immunoblots showing MtrA and SigA in Mtb dnaAcos grown at 30°C for 30 h and actively growing cultures at 37°C. Panel iii: MtrA and SigA band intensities of panel ii were determined, the MtrA/SigA ratio and the p-value were determined from three independent experiments. (C) qRT-pCR analysis of select MtrA-targets normalized to that of 16S rRNA. Panel i: expression profiles of dnaN and dnaA; Panel ii: expression profiles of ftsI, dacB1 and sepF; Panel iii; expression profiles of targets rpfB, ripA, whiB2, clpX and non-targets murD and mtrB.

