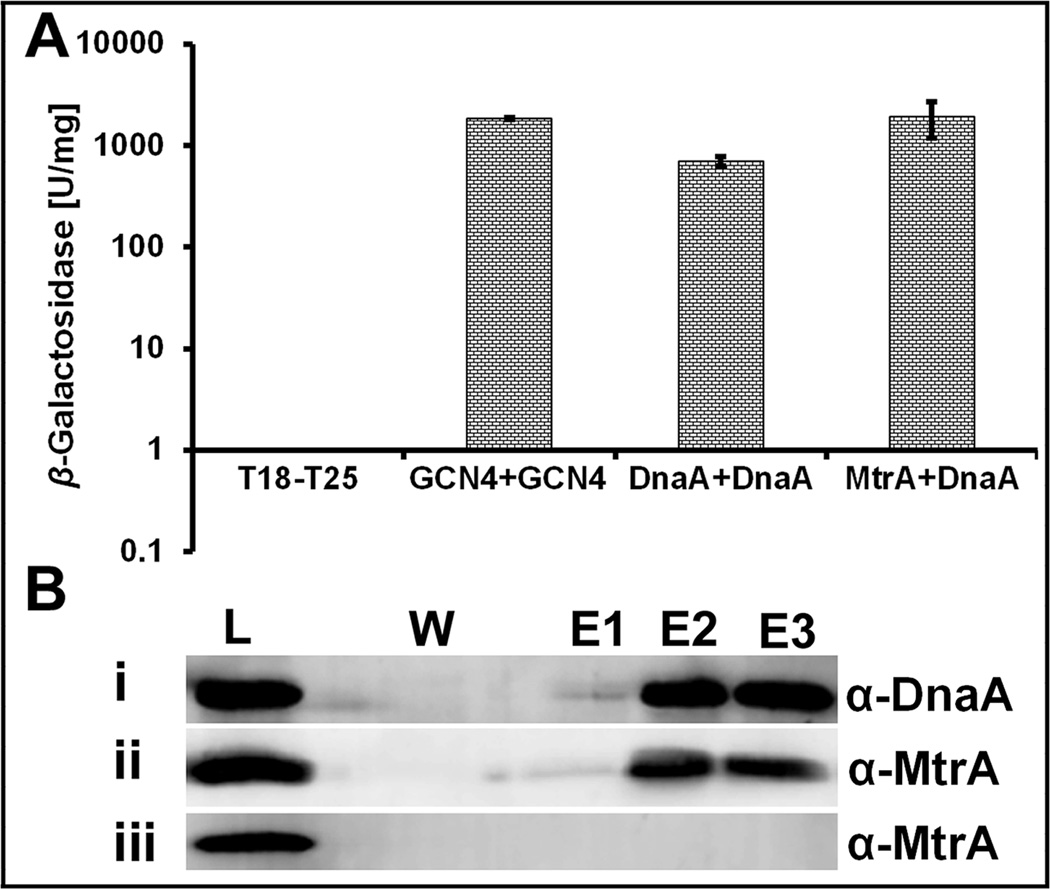
Fig. 8. BACTH and Pull-down assays.
(A) BACTH analysis showing the interaction between MtrA and DnaA in E. coli. Strength of interactions is presented as β-galactosidase units per milligram protein as described under methods. GCN4-GCN4 is positive control. Mean ± SD values from three independent experiments are shown. (B) Immunoblots showing pull-down of DnaA and MtrA proteins. M. smegmatis lysates containing DnaA-His and MtrA were mixed and processed for pull-down reaction on Ni-NTA resin as described in text. Eluted proteins were examined following immunoblotting with DnaA (panel i) and MtrA (panel ii) antibodies. Pull-down reaction with M. smegmatis MtrA lysate was performed and eluted samples were probed with MtrA antibodies (panel iii). W refers to the sample collected after washing the resin 8× with buffer containing 20 mM imidazole whereas E1, E2 and E3 are elutions with 300 mM imidazole. L= load. Note - panel iii lane corresponding to W does not contain MtrA although wash sample 1 contained MtrA (data not shown).

