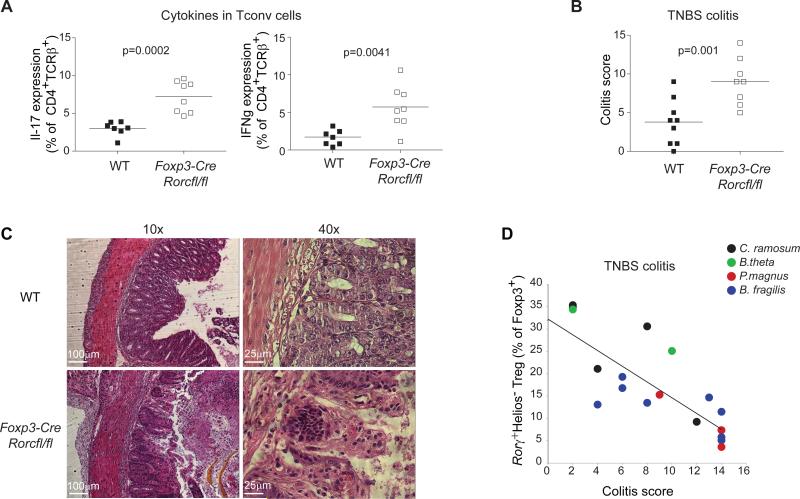
Figure 4. Rorγ+ Tregs control gut inflammation.
A: Frequency of Il17a and IFNγ expression in Foxp3−CD4+ Tconv cells from Foxp3-cre x Rorcfl/fl mice and control Foxp3-cre x Rorc+/+ littermates at steady state; p=0.0002 and p=0.0041, paired Student's t test . Each point is an individual mouse. Data representative of ≥ 3 independent experiments.
B/C: Colitis score (B) and histology (C) of Foxp3-cre x Rorcfl/fl mice and control Foxp3-cre x Rorc+/+ littermates challenged with TNBS, calculated based on weight loss, histologic score and other physical parameters; p=0.001 as determined by paired Student's t test . Each point is an individual mouse. Data representative of >3 independent experiments. D: Correlation between TNBS-colitis score (x-axis) with frequency of Rorγ+Helios− within colonic Tregs in GF mice monocolonized for 2 weeks with bacteria that elicit different levels of Rorγ+Helios− Tregs prior to TNBS colitis induction. Pearson r= 0.82, p<0.0001. Each point is an individual mouse. Data pooled from 4 experiments.

