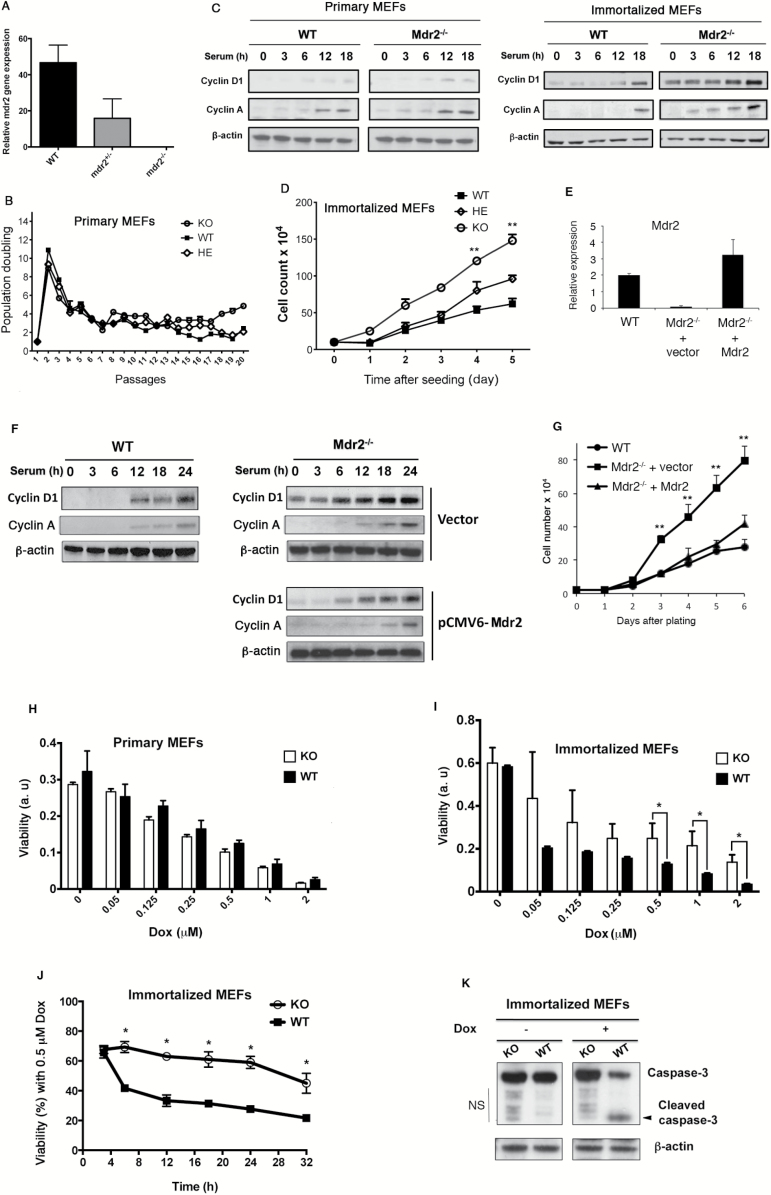
Figure 1.
Loss of Mdr2 increases cell proliferation and resistance to apoptosis. (A) Mdr2 mRNA expression in Mdr2 +/+, Mdr2 −/+ and Mdr2 −/− MEFs at passage 3 by qPCR. (B) Primary Mdr2 +/+, Mdr2 −/+ and Mdr2 −/− cell proliferation on a 3T3 protocol. Data shown are representative of cell proliferation of three independent MEF preparations from littermate embryos. (C) Primary and immortalized WT and Mdr2 −/− cells were synchronized by serum starvation and stimulated by 10% serum. Cell lysates were prepared at the indicated time after stimulation and analyzed by immunoblotting. Similar results were obtained with two other independent clones. (D) Increased cell proliferation in immortalized Mdr2 −/− cells. Equal numbers of spontaneously immortalized WT and Mdr2 −/− MEFs were plated in triplicate. Cell numbers were determined during 5 days. Data presented are the mean values ± standard deviation obtained from three independent cell cultures. The experiments were repeated with two other independent clones. The asterisk indicates significant difference between WT and KO. **P < 0.005, Student’s test. KO: Mdr2 knockout, HE: Mdr2 heterozygote. (E) Ectopic expression of Mdr2 in Mdr2 −/− MEFs. Mdr2 mRNA expression in WT MEFs, Mdr2 −/− MEFs transfected with empty vector and Mdr2 −/− MEFs transfected with vector expressing Mdr2 by qPCR. (F) Reduced cyclin D1 and cyclin A expression in Mdr2 −/− cells after introduction of Mdr2 was detected by immunoblotting with anti-cyclin D1 and anti-cyclin A antibodies. (G) Growth curve of immortalized vector-transfected Mdr2 −/− MEFs, Mdr2-transfected Mdr2 −/− MEFs and WT MEFs. Equal numbers of cells were plated in triplicate at the beginning of the experiments. Cell numbers were determined every day for a total of 6 days. Data presented are the mean values ± standard deviation obtained from three independent cell cultures. The experiments were repeated with two other independent Mdr2-transfected Mdr2 −/− pools. **P < 0.005, Student’s test. Primary (H) and immortalized (I) WT and Mdr2 −/− MEFs were treated with increasing doses of Dox. Cell viability was analyzed by MTT assay. Data presented are the mean values ± standard deviation obtained from three independent experiments. The experiments were repeated with two other independent preparations of MEFs. a.u.: arbitrary unit. (J) Immortalized MEFs were treated with 0.5 μM Dox for different times. Cell viability was examined at indicated time points by MTT assay. *P < 0.05, Student’s test. KO: Mdr2 knockout cells. (K) Proteins were extracted from immortalized MEFs without treatment or with treatment of 0.5 μM Dox for 12h and analyzed by immunoblotting with anti-caspase-3 antibody. NS: non-specific.

