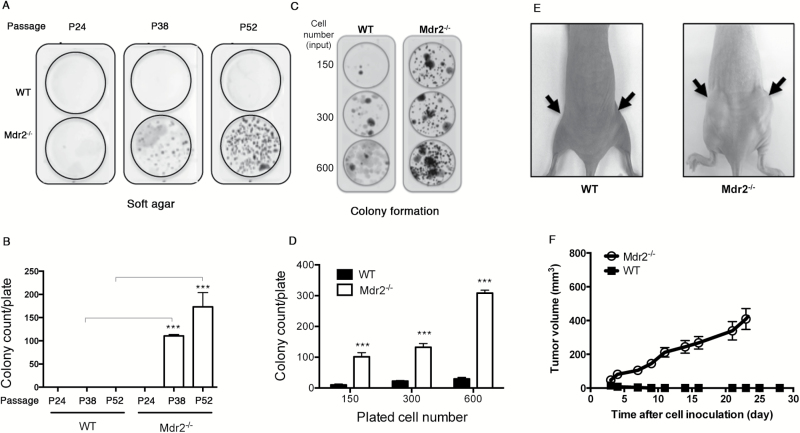
Figure 4.
Spontaneous transformation in Mdr2 −/− MEFs. (A, B) Soft agar assay of WT and Mdr2 −/− MEFs at different passages. Data presented are the mean values ± standard deviation obtained from three independent cell cultures. The experiments were repeated with two other clones from independent MEF preparations. The asterisk indicates significant difference between Mdr2 −/− and WT cells at the same passage. ***P < 0.0005, Student’s test. (C, D) Focus formation assay of WT and Mdr2 −/− MEFs at passage 38. Data presented are the mean values ± standard deviation obtained from three independent cell cultures. The experiments were repeated with two other clones from independent MEF preparations. The asterisk indicates significant difference between Mdr2 −/− and WT cells when seeded with the same number of cells. ***P < 0.0005, Student’s test. (E, F) Tumorigenicity of transformed Mdr2 −/− MEFs in athymic BALB/c mice. Data presented are the mean values ± standard deviation obtained from two flanks of five mice. The experiments were repeated once.

