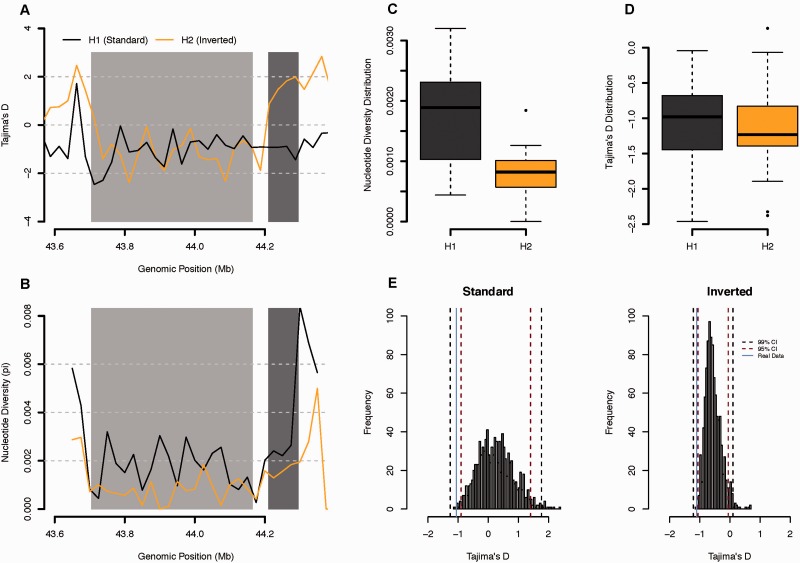
Fig. 4.
—Sliding window analysis of the interhaplotypic variation of the 17q21 major haplotype families. Distribution of nucleotide diversity (π) and Tajima’s D estimates obtained for the genomic region encompassing the inverted rearrangement. (A) Values of Tajima’s D estimated over genomic windows of 25 kb without overlap. Each color represents one of the major haplotype families. Light gray rectangle encompasses the genomic position covered by the 17q21-inv. Dark gray rectangle encompasses the expected position of the H2-specific duplication—CNP155. (B) Estimates of nucleotide diversity over genomic windows of 25 kb without overlap. Each color represents one of the major haplotype families. (C) Boxplots displaying the nucleotide diversity distribution between H1 (dark gray) and H2 (orange) haplotypes. (D) Boxplot displaying the Tajima’s D distribution between H1 (dark gray) and H2 (orange) haplotypes (E) Tajima’s D distribution from the simulated data obtained over 1,000 runs. Left and right histogram represents the Tajima’s D scores obtained for the standard and inverted orientation, respectively. Solid blue line depicts the mean score of Tajima’s D for each orientation using real data. Dashed lines present the confidence intervals calculated for 99% (black line) and 95% (red line).

