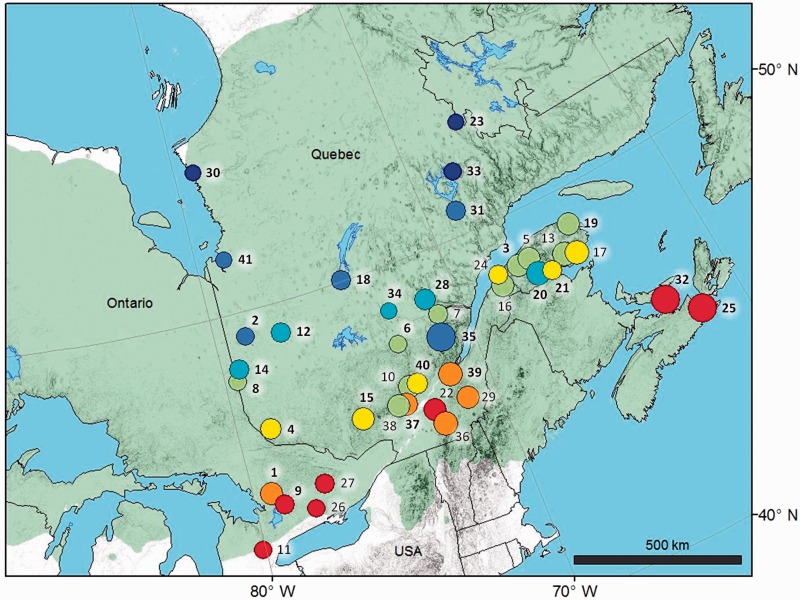
Fig. 1.—
Location of the 41 populations of Picea glauca sampled in eastern Canada. Numbers identify each population (supplementary table S1, Supplementary Material online). Bold numbers indicate the 27 populations containing at least 4 sampled individuals (see text). Circle color represents mean annual temperature, from warmer (red) to cooler (dark blue). Circle size represents total annual precipitation, from drier (small size) to moister (large size). The green area represents the distribution range of P. glauca in the region.

