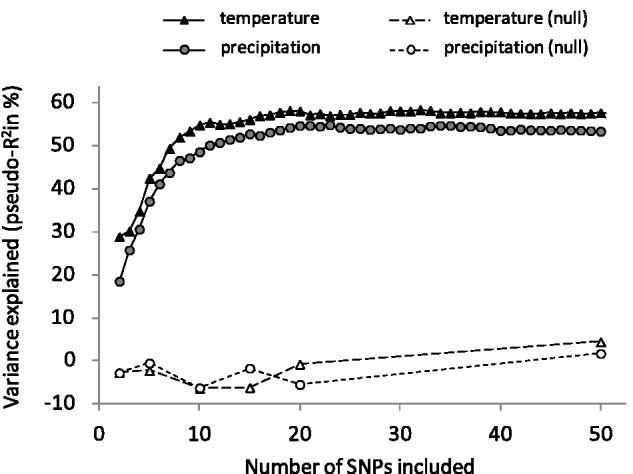
Fig. 4.—

Variance explained by Random Forest models with various numbers of SNPs included in the backward elimination procedure (see Materials and Methods). Models containing between 50 and 100 SNPs are not displayed because the plateau shown here extended until 100 SNPs. Variance explained by randomly selected SNPs (null models) could be slightly negative, meaning that these SNPs were not important. Each point represents the variance explained by the corresponding model, averaged over at least five independent runs of this model.
