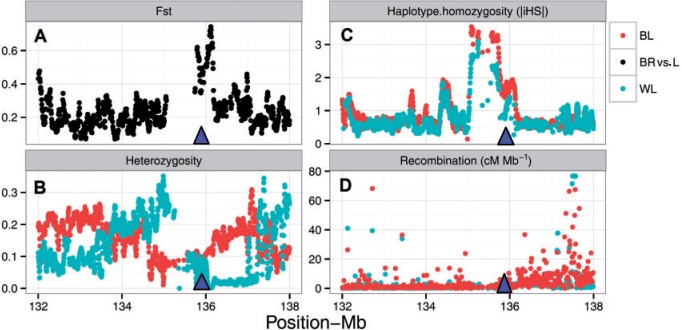
Fig. 2.—
A graphical representation of candidate OPG gene region on GGA2. Local parallel divergence between broilers (BR) and layers (L) are depicted as Fst in black. Sliding-window analyses of Fst, |iHS|, and heterozygosity across the 4-Mb interval are plotted as overlapping 40 kb windows in steps of 5 kb. Recombination rates are plotted in 10 kb windows and triangle shows the position of gene.

