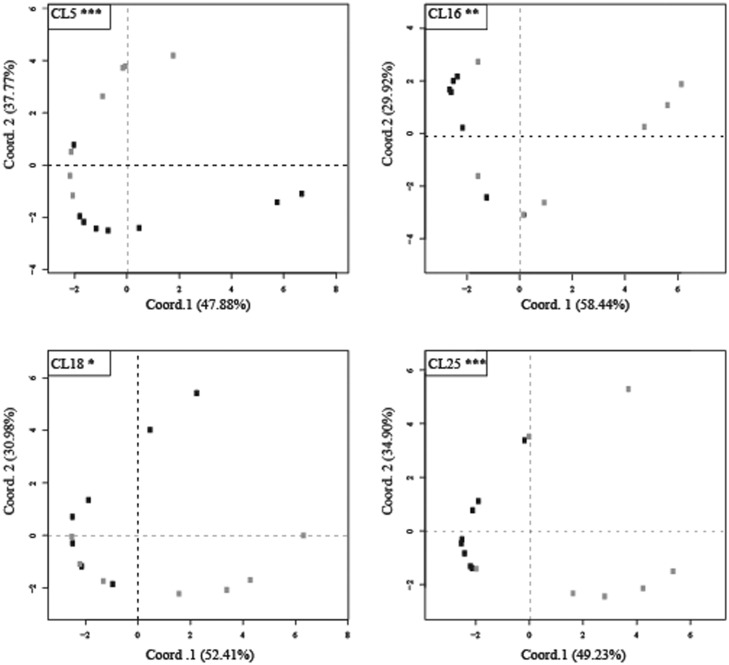
Fig. 5.—
PCA plots of redundancy values of four clusters (CL), produced by RepeatExplorer, in cultivars (dark dots) and wild accessions (light dots) of Helianthus annuus. The percentage of variation accounted by each axis is reported. Asterisks mark permutational MANOVA significance with the following significance codes: ***0.001; **0.01; *0.05.

