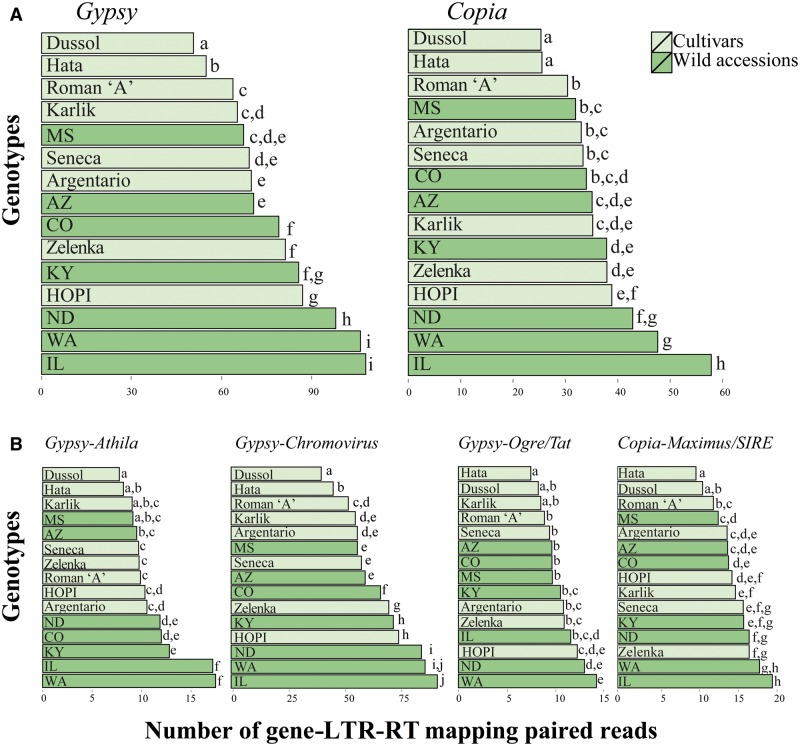
Fig. 6.—
Frequency of gene-RT mapping paired reads in the 15 genotypes analyzed in all Gypsy and Copia LTR-RTs found (A) and in Athila, Chromovirus, Ogre/Tat, and Maximus/SIRE LTR-RTs (B). Bars not sharing the same letter are to be considered as different according to a threshold indicating the extent of differences related to random sampling of reads (see Materials and Methods).

