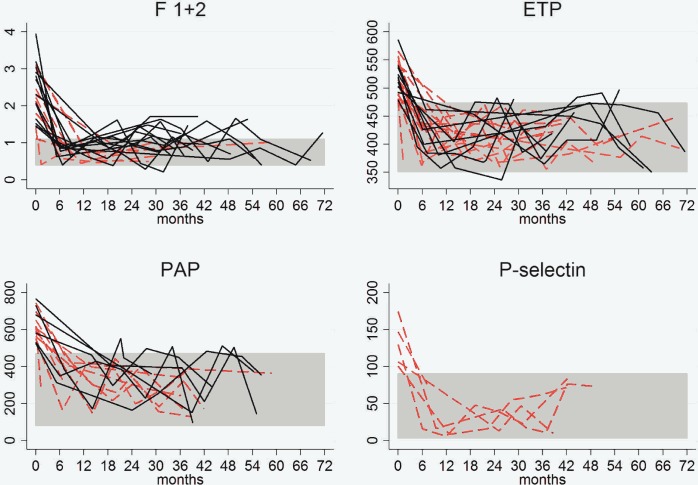
Fig 1. Hemostasis factor levels (baseline and follow-up) in patients with altered levels before treatment who achieved levels within normal ranges during follow-up.
*The discontinuous red lines indicate patients who maintained normal values throughout follow-up. The continuous black lines indicate patients who experienced a return to abnormal values at some time during the follow-up. Abbreviations: ETP, endogenous thrombin potential; F 1+2, prothrombin fragment 1+2; PAP, plasmin-antiplasmin.

