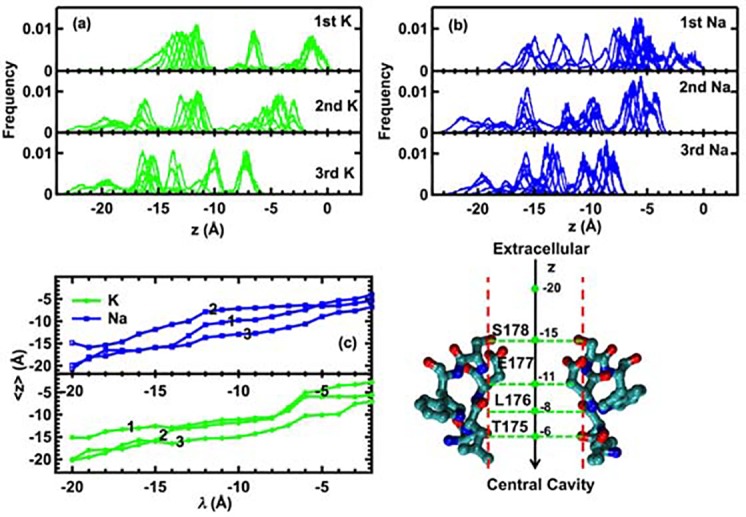
Fig 4. (a-b) Histogram of z-coordinate positions of all ions during the three-ion inward pulling protocol. (c) Averaged z-coordinate of each ion in the three-ion configurations during the pulling simulations.

The numbers indicate the same ordered numbers in (a-b). The NavAb selectivity filter is shown on the right side of the Fig for reference.
