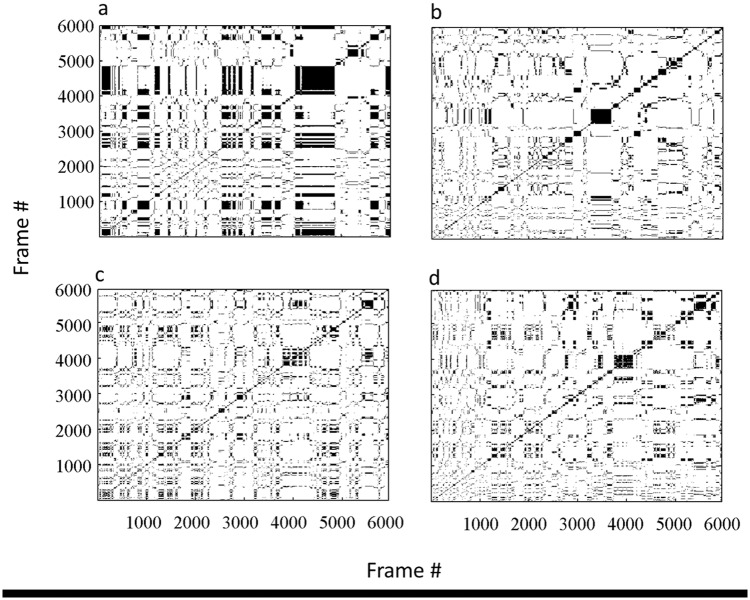
Fig 6. Recurrence plots of two rat of the same dyad.
Plots a,b represent, respectively, rat 1 when tested alone and when tested in a dyad. Similarly, plots c,d represent rats 2. When tested alone (left insets) the rats exhibited more periodic and predictable behavior, as reflected in the long vertical and diagonal lines that result in densely packed rectangles, which indicate frequent returning to locations at the same distance from the focal point. In contrast, when the same rats were tested in a dyad, the recurrence plot features smaller squares and shorter diagonal and vertical lines (right insets). These indicate less frequent returning to locations at the same distance from the focal point, and that the rat stopped for shorter periods of time when repeatedly visiting a location. Altogether, the behavior of the rats in the dyad trial (b,d) was more chaotic and less predictable compared to their behavior in the lone trials (a,c).

