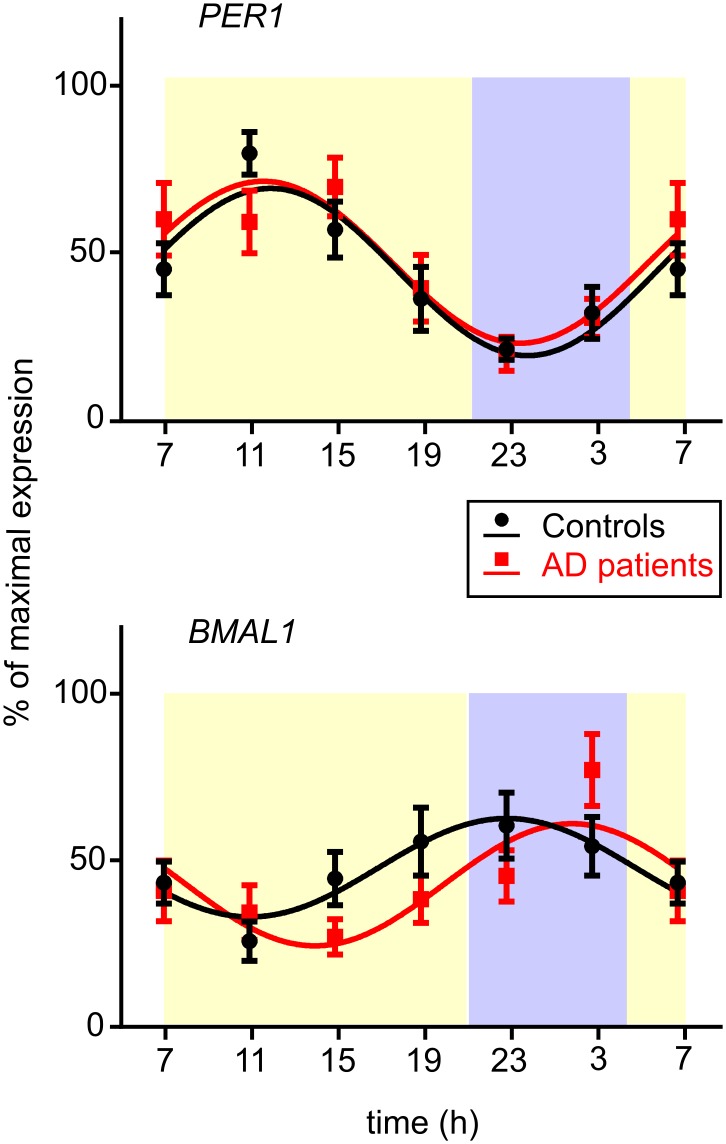
Fig 6. Daily profiles of clock gene expression in buccal cells of controls and AD patients.
PER1 (upper graph) and BMAL1 (lower graph) expression profiles were compared in controls (black circles, n = 13) and AD patients (red squares, n = 13). Data are expressed as % of maximal expression levels (means ± S.E.M.) and fitted with cosine curves (controls: black curves, AD patients: red curves). The X-axes represent the time of day in hours.

