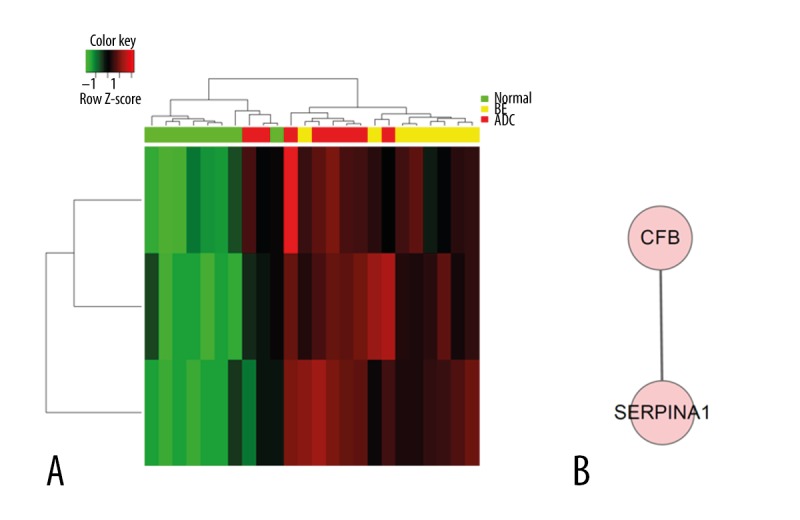
Figure 4.

Complement and coagulation cascades pathway and corresponding biological network significantly enriched in both comparisons. Red indicates high expression, and green indicates low expression. (A) Heat map of hierarchical clustering of DEGs in “complement and coagulation cascades”. (B) Biological network of “complement and coagulation cascades”.
