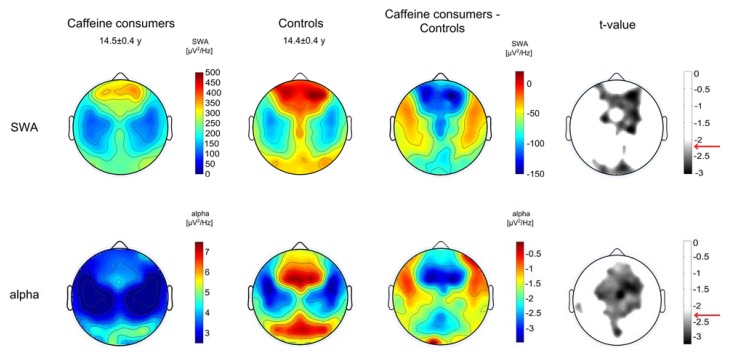
Figure 3.
Regional sleep slow-wave activity (SWA, 1–4.5 Hz) and alpha activity (8.25–9.75) in caffeine consumers (n = 16) and controls (n = 16). Upper panels show the topographical distribution of SWA averaged for the two groups in NREM stages 2 and 3 during the first two hours of NREM sleep, group differences and the level of significance (t < −2.21, two-tailed, unpaired t-test). Lower panels show the topographical distribution of alpha activity averaged for the two groups in NREM stages 2 and 3 during the first two hours of NREM sleep, group differences and the level of significance (t < −2.25, two-tailed, unpaired t-test). The significance level is indicated with a red arrow. Values are color coded (maxima in red, minima in blue, respectively maxima in white, minima in black for t-values) and plotted on the planar projection of a hemispheric scalp model. Maps for caffeine consumers and controls are presented using the same color scale, and statistical maps are proportionally scaled to optimize color contrast. Values between electrodes were interpolated in each plot.

