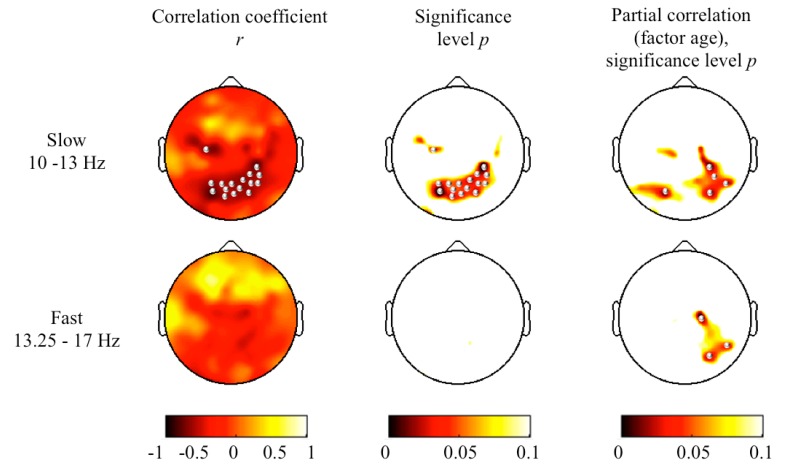
Figure 4.
Topographical maps of Pearson correlations between processing speed and slow sigma power (10–13 Hz) and fast sigma power (13.25–17 Hz). Left column: maps for Pearson correlation coefficients (r); middle column: corresponding p-value; right column: maps for p-values from partial correlations (factor “age”). Power maps were individually scaled for the data range. Significant correlations (p < 0.05, one-tailed) are indicated with bullets.

