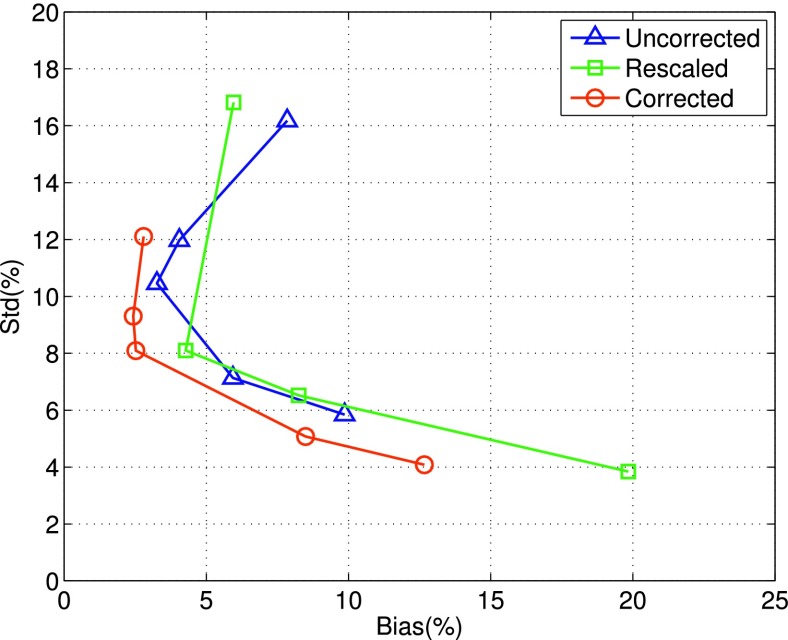
FIG. 5.
Plots of bias vs standard-deviation (std) obtained by different reconstruction methods for an ROI in the midsection of the LV. Each curve corresponds to one of the three compensation schemes, i.e., corrected, rescaled, or uncorrected. It was started with ML reconstruction (upper-left endpoint of the curve), followed by MAP reconstruction with increased smoothing. These results were from 50 noise realizations.

