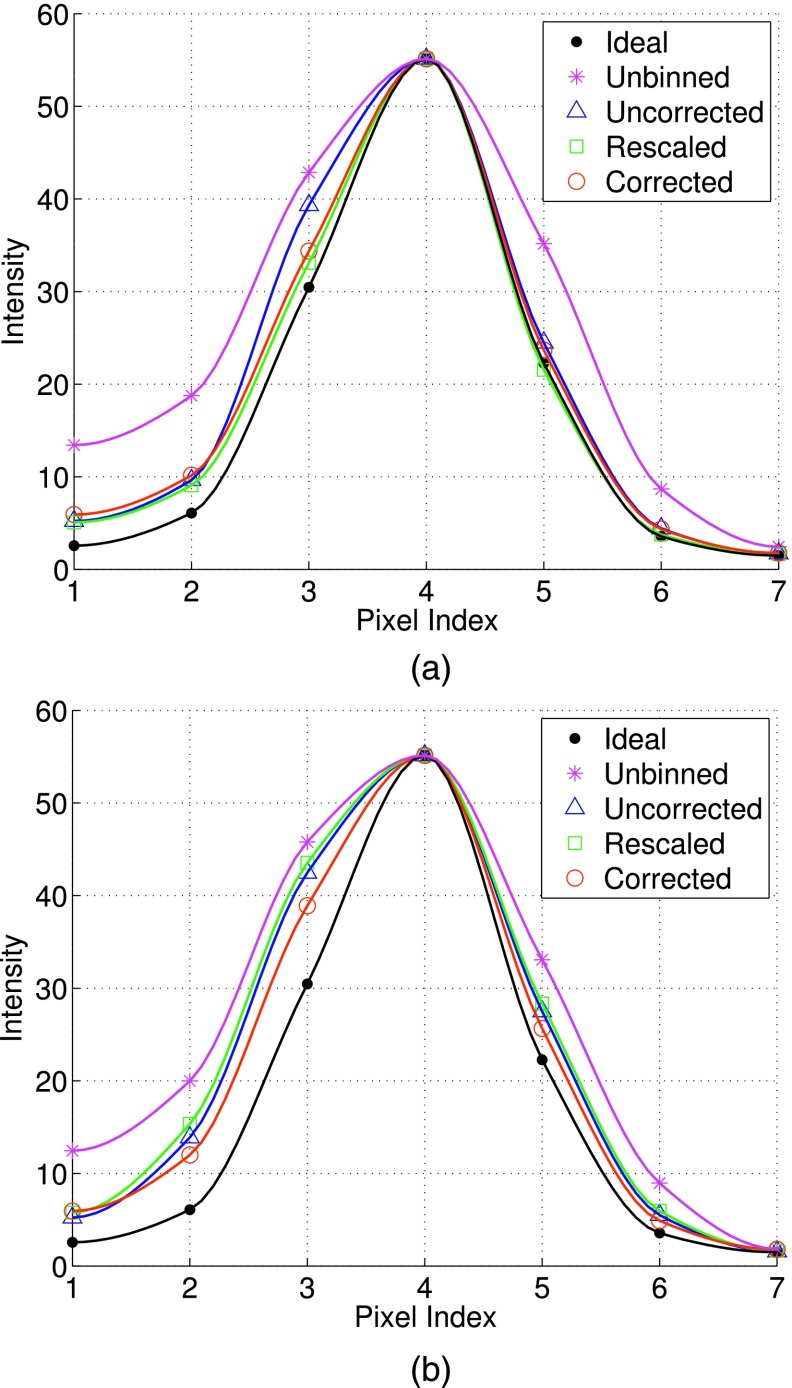
FIG. 7.
Cross-sectional intensity profiles of the LV obtained with different compensation schemes using: (a) ML reconstruction, and (b) MAP reconstruction. These plots are from the average of 50 noise realizations. To facilitate comparison, the peak intensity from different methods was scaled to be the same as that of ideal.

