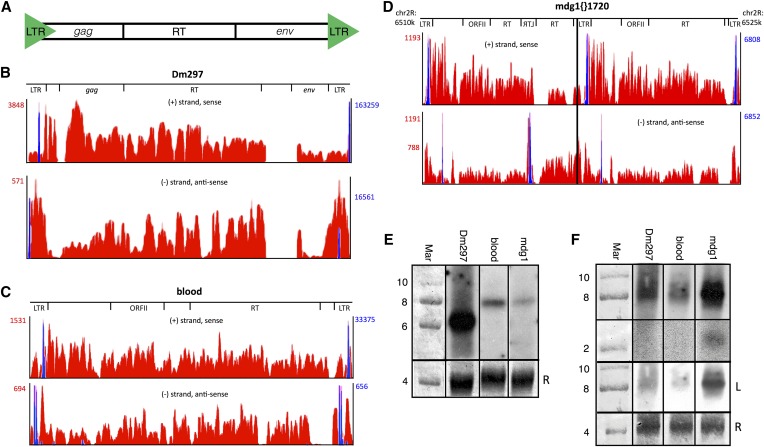
Figure 1.
LTR retroTns Dm297, blood, and mdg1{}1720 produce AS transcripts from intraelement tss in or near the LTRs. (A) Schematic of Drosophila LTR retroTns. (B–D) Bedgraphs representing S (top) and AS (bottom) nonunique RNA-seq reads mapping to each LTR retroTn are shown in red. Peak reads per million (RPM) are listed to the left (red numbers). For mdg1, two AS RPM values are listed; the top is the RPM for mdg1{}1720 and the bottom is the RPM for only the downstream canonical mdg1 element (right of the black line). Only the chromosome location of mdg1{}1720 is shown as Dm297 and blood bedgraphs are representative examples. Relative locations of specific ORFs are shown above the bedgraphs. Nonunique small-capped RNA-seq reads representing tss are overlaid in blue and RPM values are listed to the right (blue numbers). (E) Representative Northern blots of S LTR retroTn transcripts. The probe used for each blot is indicated above. The first lane is methylene blue-stained RNA marker; the sizes of bands are shown to the left of the blots. Methylene blue-stained 28S rRNA is used as a loading control (bottom) and is marked with an “R.” (F) Representative Northern blots of AS LTR retroTn transcripts. The top two panels are from the same longer exposure film while the third panel (“L”) is a lighter exposure. Other details are as in E.

