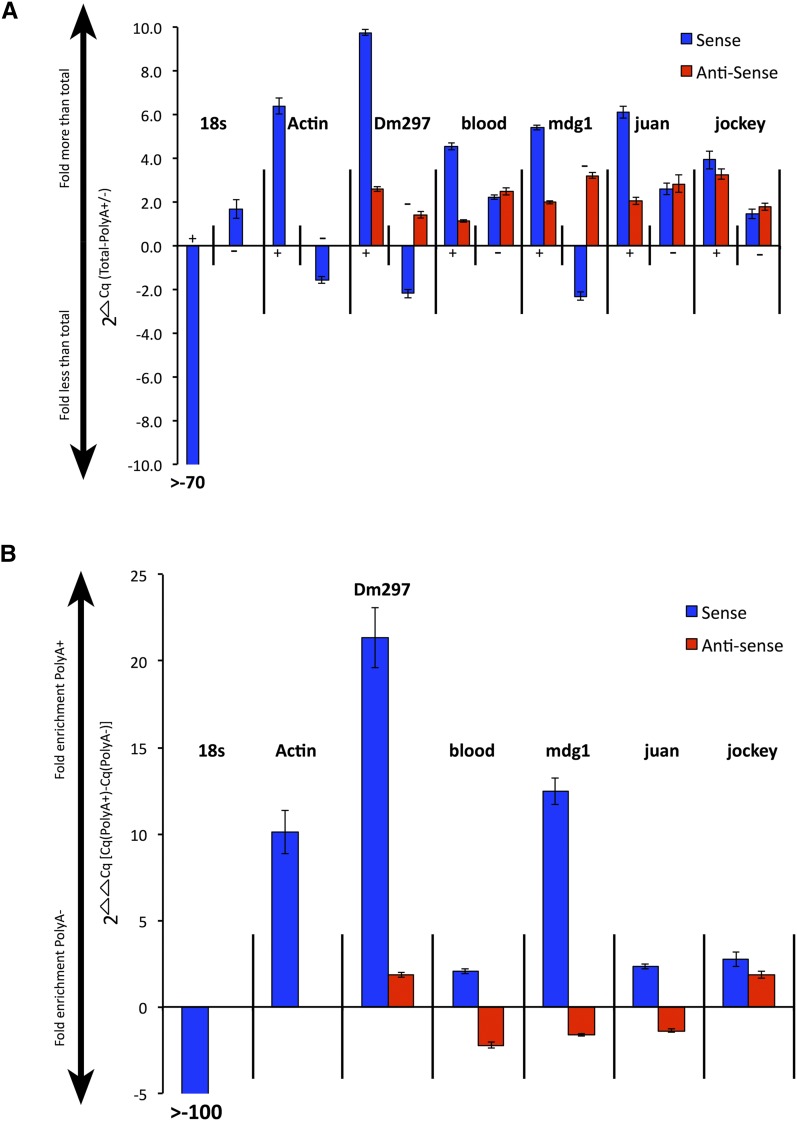
Figure 4.
LTR and non-LTR retroTn AS transcripts lack strong polyadenylation. (A) Graph of S and AS transcript fold differences in polyA+ or polyA− fractions compared to total RNA. 2ΔCq is the y-axis and represents (total RNA – polyA+ or polyA−). PolyA+ or polyA− fractions are indicated along the x-axis as + or – signs. S transcripts are blue bars and AS transcripts are red bars. The name of each retroTn or control is listed above the appropriate group. Error bars represent standard deviation of strand-specific qPCR technical triplicates. (B) Graph of direct comparison of polyA+ to polyA− levels for each retroTn S/AS transcript pair. Fold enrichment values for polyA+ or polyA− fractions are shown along the y-axis (2ΔΔCq) where the ΔΔCq equals [(total-polyA +)-(total-polyA −)]). S and AS transcripts are shown along the x-axis; S bars are blue and AS bars are red. Error bars represent standard deviation of strand-specific qPCR technical triplicates.

