Figure 5.
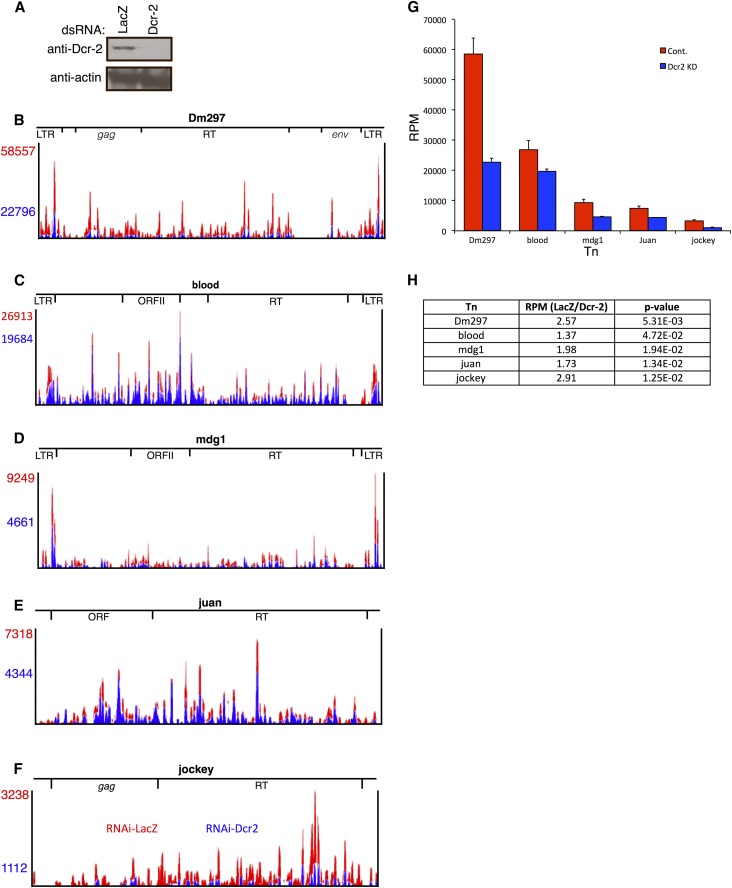
Dcr-2 depletion decreases retroTn-derived esiRNA levels. (A) Representative Western blot of Dcr-2 depletion. The antibody used is indicated to the left of blots and dsRNA for RNAi is labeled above blots. (B–F) Bedgraphs of esiRNAs mapping to retroTns in control and Dcr-2-depleted Dmel-2 cells. The control is red and the Dcr-2 knockdown is in blue. RPM values are listed to the left of bedgraphs and are color coordinated. Relative locations of specific ORFs are shown above the bedgraphs. (G) Graphs of esiRNA levels in control and Dcr-2-depleted Dmel-2 cells (control, red; Dcr-2 knockdown, blue). RPM values are on the y-axis and retroTns are indicated along the x-axis. Error bars represent standard deviation of technical triplicates. (H) A table reporting the ratio of esiRNA levels (RPM) between the control and Dcr-2 knockdown for each retroTn (middle column) is shown. RetroTn is indicated in the left column and P-value (unpaired t-test) is indicated in the right column.

