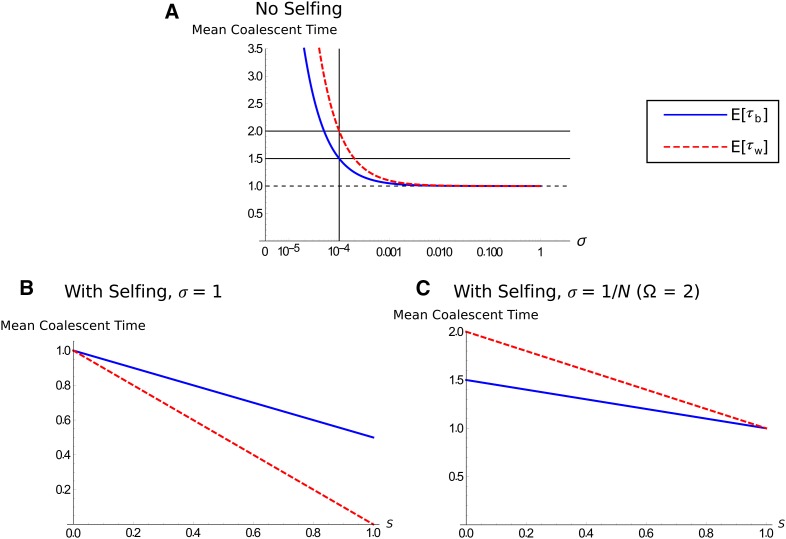
Figure 2.
Expected coalescent times with different reproductive systems. The population size for all plots is N = 10,000. (A) Expected mean coalescent time according to Equation 6 in coalescent time units as a function of sex σ. The blue line represents between-individual mean coalescent time , and the red line is within-individual mean coalescent time . The vertical line represents (), and the horizontal solid lines show the predicted mean coalescent times for this value (; on the coalescent timescale), whereas the horizontal dashed line shows . (B and C) Expected coalescent time if selfing is also included, according to Equation 9. Line colors are the same as in A, with (B) σ = 1 or (C) σ = 1/N ().

