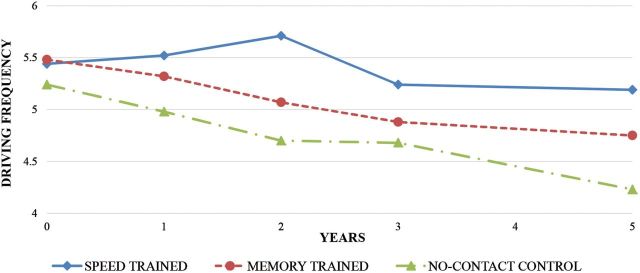
Figure 2.
Driving frequency by training and control groups in at-risk participants who received booster sessions. Note: Driving frequency means are presented (range 0–7). Driving frequency was the average number of days driven in a week. Training and control groups did not differ on baseline driving frequency (see Table 1, p > .05). Participants were at-risk for future mobility declines based on the baseline Useful Field of View Test score. Booster training occurred at years 1 and 3. Cohen’s d for speed of processing trained group compared with no-contact control group was 0.53.

