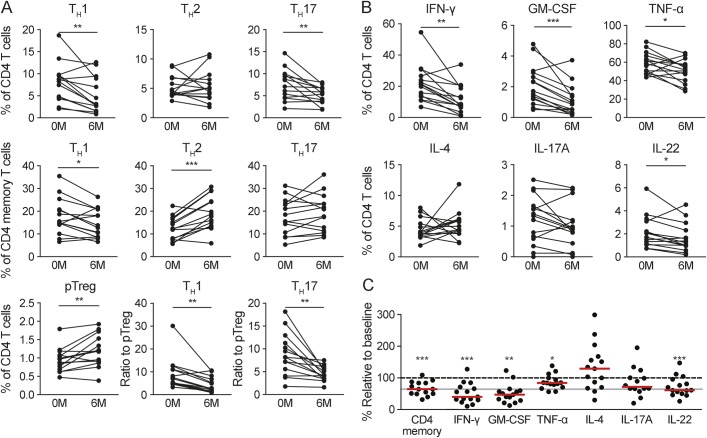
Figure 2. Effect of DMF therapy on the T helper cell repertoire and cytokine production.
Peripheral blood mononuclear cells (PBMCs) from patients at baseline (0M) and after 6 months of therapy (6M) with dimethyl fumarate (DMF) were analyzed by flow cytometry for changes in the T cell compartment with focus on helper T (TH) cells (A, n = 14) and their cytokine production (B, C, n = 15). (A) TH1 (left), TH2 (center), and TH17 cells (right) as percentage of CD4+ T cells (top) and memory CD4+ T cells (middle) at baseline and after 6 months of treatment; bottom: peripheral regulatory T cells (pTreg) as percentage of total CD4+ T cells (left) and TH1 as well as TH17 (in percent of CD4+ T cells) cells as ratio to pTreg (center and right). (B) PBMCs were stimulated with Leukocyte Activation Cocktail for 6 hours and analyzed by flow cytometry for the intracellular amount of interferon (IFN)-γ (top left), granulocyte-macrophage colony-stimulating factor (GM-CSF) (top center), tumor necrosis factor α (TNF-α) (top right), interleukin (IL)-4 (bottom left), IL-17A (bottom center), and IL-22 (bottom right). The given results are the percentage of total CD4+ T cells. (C) CD4+ memory cells and data from (B) depicted as percentage relative to baseline after 6 months of treatment. Red bars indicate the median, and the gray line marks the median reduction of CD4+ memory T cells. Statistical analysis was done by paired Student t test for matched samples and Wilcoxon signed rank test for the comparison of the median cytokine production to baseline, *p < 0.05, **p < 0.01, ***p < 0.001.

