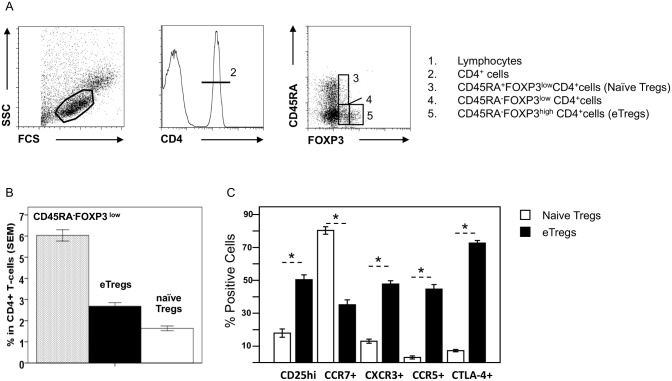
Fig 1. Phenotyping of FOXP3+ Tregs.
A) Gating strategy for accurate determination of the proportion of regulatory T cells in PBMCs 1. Lymphocytes; 2. CD4+ T cells; 3. CD4+CD45RA+FOXP3low T cells; 4. CD4+CD45RA-FOXP3low T cells; 5.CD4+CD45RA-FOXP3high T cells); B) Percentage of blood CD45RA-FOXP3low non-Tregs (gray bars), CD45RA-FOXP3high T cells (black bars) and CD45RA+FOXP3low T cells (white bars) among the blood CD4+ T cells of infected patients (group 1; n = 76); C) Proportion of CD45RA-FOXP3high T cells and CD45RA+FOXP3low T cells expressing CD25, CCR7, CXCR3, CCR5, or CTLA-4 among blood CD4+ T cells in 45 patients (excluding splenectomized patients). A nonparametric test was used. * p<0.01.

